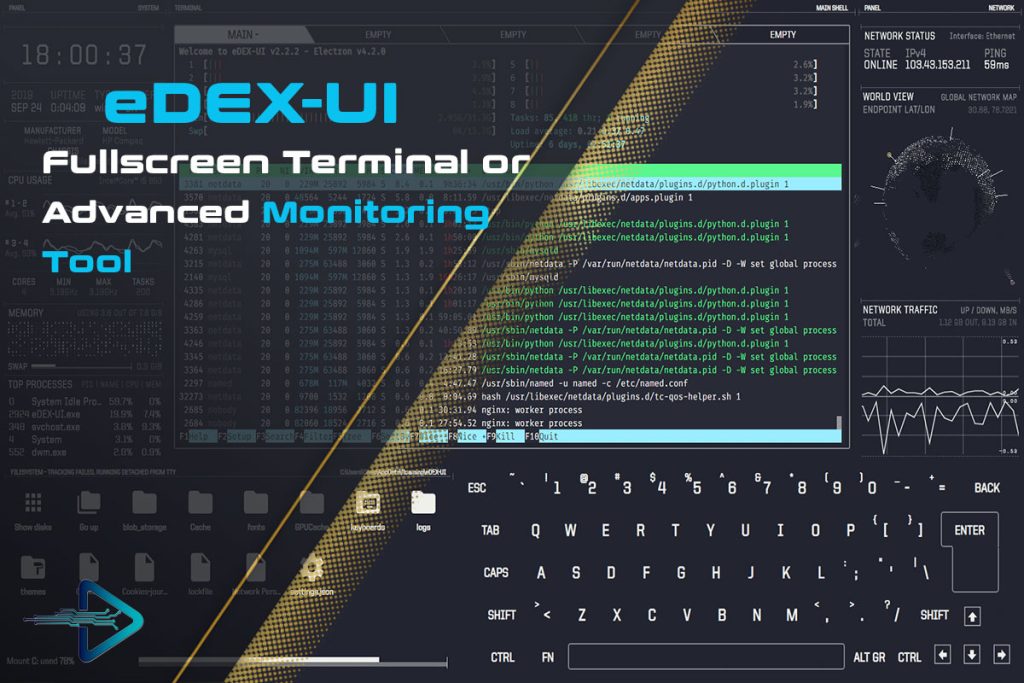
eDEX UI is a unique terminal emulator inspired by science-fiction interfaces, built to provide not just command-line access but also detailed system monitoring information in a visually appealing way. Unlike traditional terminal tools, it blends practicality with aesthetics, transforming a simple session into an immersive experience.
What sets eDEX UI apart is its ability to monitor system performance metrics while keeping users engaged with an interactive and cinematic interface. From CPU utilization to RAM usage, it provides clear visualizations that make performance tracking easier than conventional methods.
This dual approach makes eDEX UI both a productivity booster and an aesthetic choice for enthusiasts, developers, and system administrators who want to enjoy monitoring their system without sacrificing functionality.
CPU Monitoring in eDEX UI
Real-Time CPU Usage
eDEX UI presents CPU usage in real time through graphical meters, allowing users to immediately observe processor activity. It displays per-core statistics, ensuring that system behavior is transparent at any given moment.
Visual Graph Representation
With a dedicated section, eDEX UI provides CPU load graphs that highlight performance fluctuations. This gives users insights into which applications are consuming more resources.
Temperature and Load Tracking
By displaying heat and workload distribution, users can monitor processor health effectively. This helps maintain performance while avoiding overheating issues.
RAM Utilization in eDEX UI
Memory Allocation Display
eDEX UI provides a detailed breakdown of RAM allocation. It shows available, used, and cached memory to give a clear overview of how applications consume resources.
Real-Time Updates
The interface continuously updates memory usage data, making sure users never miss performance changes during demanding tasks.
Easy-to-Read Charts
Color-coded charts simplify understanding of memory consumption. These visualizations improve usability compared to plain text monitoring tools.
Network Activity Tracking in eDEX UI
Upload and Download Speeds
eDEX UI tracks both upload and download speeds, allowing users to see network load instantly. This is crucial for developers working with online resources.
Connection Monitoring
It shows active network interfaces and their activity, giving a full overview of connectivity. This ensures smoother troubleshooting of internet-related issues.
Data Throughput Analysis
Graphs illustrate data transfer rates over time, helping users understand bandwidth trends and potential bottlenecks.
Disk Usage Monitoring in eDEX UI
- Tracks available storage and total disk space
- Provides file system utilization details
- Monitors partitions for efficient management
Storage Breakdown
eDEX UI allows users to view storage data per partition, making it easier to track which areas of the disk are nearing capacity.
Real-Time Tracking
Usage metrics update continuously to prevent unexpected shortages and keep the system stable.
Performance Insights
By visualizing disk read/write speeds, users can identify bottlenecks affecting performance.
System Information Overview in eDEX UI
- Displays OS details such as kernel version
- Highlights hardware information for quick reference
- Shows uptime and system identity in real time
Centralized Dashboard
eDEX UI integrates all essential information into one place, allowing users to access it without switching between commands.
Hardware Transparency
It highlights CPU model, GPU info, and other hardware details, offering a clear overview of system specifications.
Operating System Details
With kernel version and distribution data, users can quickly verify system compatibility and performance.
User Interface Features of eDEX UI
- Cyberpunk-inspired futuristic design
- Customizable layouts with different skins
- Immersive terminal experience with multiple tools
Interactive Experience
The terminal feels like a sci-fi control panel, designed for both practical use and visual enjoyment.
Customization Options
Users can change themes, fonts, and layouts to suit their preferences, enhancing workflow personalization.
Multi-Tool Integration
Along with system monitoring, eDEX UI integrates a file manager and network tools for added functionality.
Conclusion
eDEX UI revolutionizes the way users experience terminals by combining system monitoring with immersive visuals. From CPU and RAM tracking to disk, network, and hardware details, it delivers real-time insights in a stylish interface. Its cyberpunk-inspired design elevates productivity while providing transparency of system health. Whether used by developers, enthusiasts, or administrators, eDEX UI remains a perfect blend of aesthetics and functionality, making system monitoring both efficient and enjoyable.