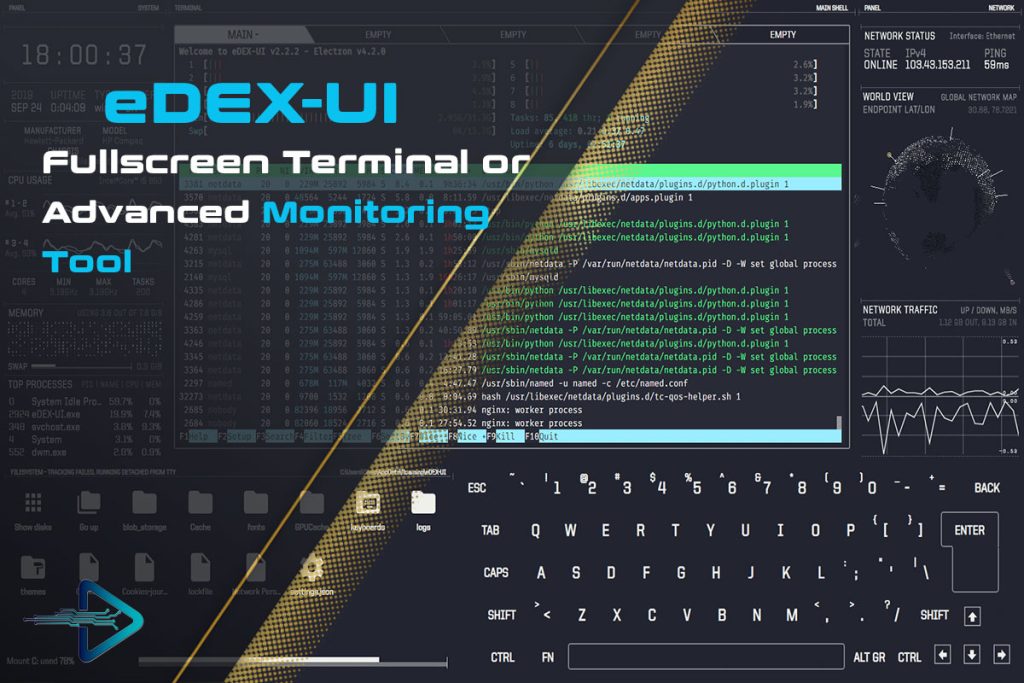
eDEX UI is a futuristic terminal emulator and system monitor that has gained attention due to its cyberpunk-inspired design and immersive user experience. It was designed to look like an interface from science fiction movies, making it popular among developers, tech enthusiasts, and hobbyists who enjoy a visually engaging workspace. Beyond its aesthetics, eDEX UI provides practical monitoring tools that allow users to keep track of their system’s performance, including CPU usage, memory allocation, disk usage, and network activity.
One of the most frequently asked questions about this tool is related to its network monitoring capabilities. Network activity is a crucial part of system management, as it allows users to observe how data is being transmitted and received. For developers, gamers, and system administrators, being able to visualize network behavior in real time is both useful and educational. eDEX UI integrates this functionality into its sleek design, making it stand out compared to traditional terminals.
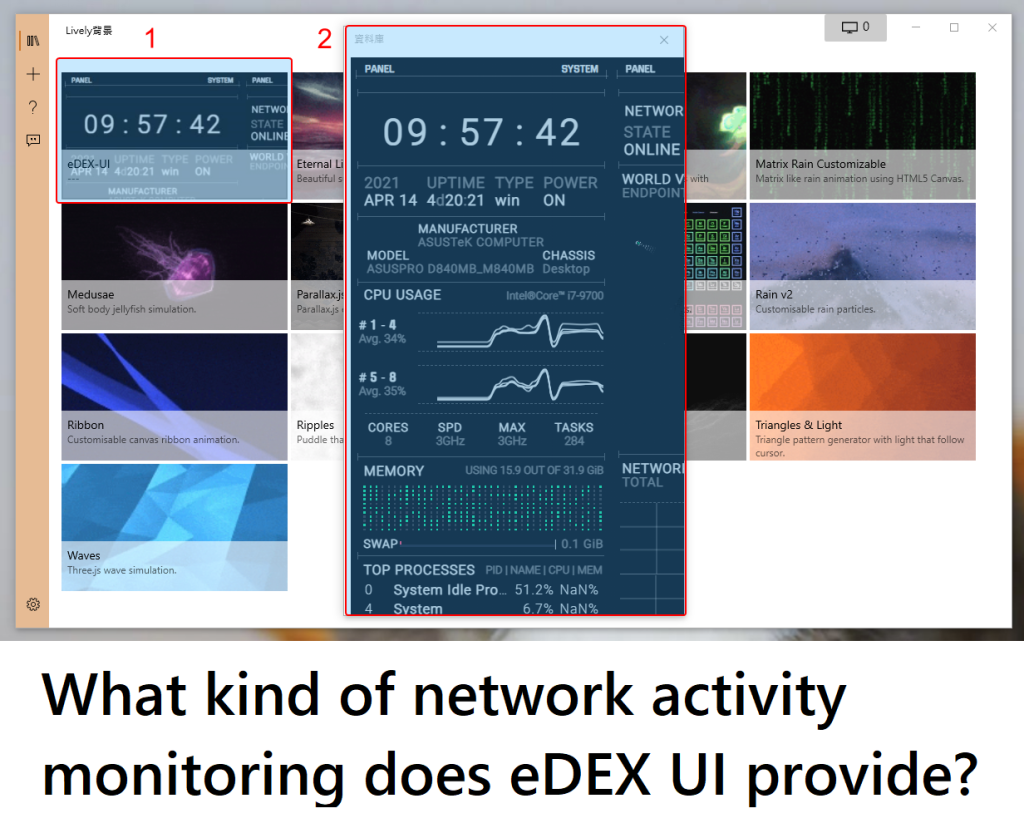
In this article, we will explore what kind of network activity monitoring eDEX UI provides, how it works, what limitations it has, and how it compares with dedicated monitoring tools. We’ll dive deep into the features, provide examples of use cases, and analyze why users might prefer this tool despite its relatively simple monitoring compared to professional-grade alternatives.
Understanding eDEX UI
What is eDEX UI?
eDEX UI is a cross-platform terminal emulator with a built-in system and network monitor. It runs on Linux, macOS, and Windows, offering users a consistent interface across different operating systems. The software was heavily inspired by science-fiction interfaces, particularly the ones shown in the movie TRON: Legacy, giving it a holographic, futuristic vibe.
Why Do People Use eDEX UI?
The primary appeal of eDEX UI lies in its visual presentation. Unlike traditional terminal emulators, which are text-heavy and minimal, eDEX UI presents data in a dashboard-like format. Users can see system information, a file explorer, terminal windows, and real-time stats in a single interface. For people who enjoy blending productivity with visual flair, eDEX UI delivers a unique experience.
System Monitoring Features
While the tool was never meant to replace professional monitoring utilities, it includes several real-time stats panels. These cover:
- CPU Usage: Displays how much processing power is being consumed.
- Memory Usage: Shows RAM allocation and availability.
- Disk Activity: Monitors read/write speeds and storage.
- Network Activity: Provides data about upload and download throughput.
This balance of functionality and style makes eDEX UI an attractive option for casual monitoring.
Network Activity Monitoring in eDEX UI
How Network Monitoring Works in eDEX UI
At its core, eDEX UI pulls network statistics from the host operating system using built-in system calls. On Linux, it gathers data from /proc/net/dev. On Windows and macOS, it uses equivalent system APIs. These values are then visualized in the UI as graphs and numerical indicators, updating in real time.
The interface shows:
- Download Speed (Inbound Traffic): The rate of data received from the internet or local network.
- Upload Speed (Outbound Traffic): The rate of data sent out.
- Total Bytes Transferred: Sometimes displayed depending on the system’s configuration.
Visual Display of Network Activity
The network stats in eDEX UI are presented on the right-hand side of the interface in most layouts. They appear as dynamic graphs that scroll in real time, paired with numerical values. This allows users to quickly glance at their bandwidth usage. While not as detailed as tools like Wireshark or iftop, the visual style makes it accessible and enjoyable to watch.
Real-Time Updates
One of the most engaging aspects is the real-time updating of data. The numbers and graphs shift every second, giving the user a live view of their system’s connectivity. This makes it useful for spotting:
- Bandwidth spikes during large downloads.
- Upload surges while sharing files.
- Network idling when no applications are active.
Advantages of eDEX UI Network Monitoring
Simplicity and Accessibility
Unlike complex command-line tools, eDEX UI provides network activity insights without needing commands or technical expertise. It’s ideal for beginners who want to learn about network behavior in a visually friendly way.
Unified Dashboard
With CPU, memory, disk, and network stats in a single place, users don’t need multiple monitoring windows. This makes it convenient for multitasking and casual system observation.
Engaging Visuals
The cyberpunk design makes even mundane monitoring feel exciting. Developers often keep eDEX UI running in the background simply because it looks good on a second monitor.
- Easy to interpret graphs.
- Aesthetic appeal for live demonstrations.
- Fun for personal setups or streaming environments.
Cross-Platform Compatibility
Because eDEX UI works on all major operating systems, users can monitor network activity on whichever platform they prefer, making it versatile across different environments.
Limitations of eDEX UI’s Network Monitoring
Lack of Depth
While eDEX UI shows upload/download speeds and bandwidth usage, it does not provide packet-level inspection or protocol analysis. Tools like Wireshark, nload, or Netdata offer far more detail.
No Historical Data
The monitoring is real-time only. Once you close the application, the stats are gone. There’s no built-in logging or trend analysis.
Resource Consumption
Because of its heavy visual interface, eDEX UI consumes more system resources compared to lightweight tools like htop or vnstat. This makes it less practical for low-power systems.
- GPU and CPU overhead due to visuals.
- Not ideal for server environments.
- Slower on older hardware.
Limited Use Cases
For professional sysadmins or network engineers, eDEX UI’s monitoring is insufficient for deep diagnostics. It works best as a casual or supplementary monitoring tool.
Comparing eDEX UI with Other Network Monitoring Tools
eDEX UI vs. Wireshark
Wireshark is an advanced packet analyzer that captures and dissects network traffic at the protocol level. In comparison, eDEX UI only displays bandwidth usage. While Wireshark is complex and technical, eDEX UI prioritizes simplicity and aesthetics.
eDEX UI vs. nload
nload is a terminal-based monitoring tool that focuses solely on network throughput. It is lightweight, efficient, and provides graphs similar to eDEX UI, but without the visuals or integrated dashboard. eDEX UI looks better but consumes more resources.
eDEX UI vs. Netdata
Netdata is a powerful system monitoring solution that provides in-depth metrics, including network analysis with long-term data storage and web-based dashboards. eDEX UI cannot compete in depth, but it wins in visual appeal and simplicity.
Use Cases for eDEX UI Network Monitoring
For Developers
Developers may keep eDEX UI open to track network behavior while coding applications that involve data transfer, APIs, or remote servers. The live graphs provide quick feedback without switching contexts.
For Gamers
Gamers who want to see whether their network is spiking during online sessions can benefit from the real-time display. It may not diagnose issues, but it helps confirm bandwidth stability.
For Enthusiasts
Tech enthusiasts often use eDEX UI for home setups, streaming backgrounds, or demo environments. The network monitoring graphs add to the “sci-fi command center” vibe.
- Adds atmosphere to live streams.
- Engages audiences during tech talks.
- Makes system monitoring visually appealing.
Practical Tips for Using eDEX UI Network Monitoring
Monitor During Downloads
Keep eDEX UI open when downloading large files or updating software. The bandwidth usage graph makes it clear when transfers are in progress.
Use in Multitasking Environments
Since eDEX UI displays CPU, RAM, disk, and network stats together, it’s convenient to monitor overall system health while working on multiple projects.
Pair with Dedicated Tools
For deeper analysis, pair eDEX UI with a professional tool. For example, run Wireshark for packet capture while keeping eDEX UI open for at-a-glance stats.
Conclusion
eDEX UI provides a simple yet visually stunning way to monitor network activity. It shows real-time upload and download speeds through dynamic graphs and numerical data, offering users an engaging view of their connectivity. While its capabilities are limited compared to specialized tools like Wireshark, Netdata, or nload, it excels in accessibility, design, and cross-platform convenience.
For casual users, developers, or enthusiasts who value both function and aesthetics, eDEX UI is a fun and practical way to keep an eye on network activity. However, for professionals who require deep network diagnostics, it is best used alongside more advanced monitoring solutions.
In short, eDEX UI provides real-time, basic network monitoring in a visually immersive environment, making it a great addition for those who want both system awareness and a sci-fi-inspired workspace.